Posts about preprocessing

Normalizing Observations

Goal

This post aims to introduce how to normalize the observations including the followings:

  • Min-Max scaling
  • Standard scaling

image

Libraries

In [53]:
import pandas as pd
import numpy as np
from sklearn.preprocessing import minmax_scale, StandardScaler
import matplotlib.pyplot as plt
%matplotlib inline

import warnings
warnings.simplefilter('ignore')

Create a data

In [63]:
df = pd.DataFrame(data=60*np.random.randn(100)+20)
df.describe()
Out[63]:
0
count 100.000000
mean 22.664418
std 54.655875
min -123.482962
25% -13.641444
50% 27.253111
75% 56.597637
max 179.529729
In [64]:
df.hist();
plt.title('Original Data');

Normalizing

Min-Max Scaling

$$x_{min-max\,normalized} =\frac{x - min(x)}{max(x) - min(x)} $$
In [65]:
data_minmax = minmax_scale(df, feature_range=(0, 1))
pd.DataFrame(pd.Series(data_minmax.ravel()).describe())
Out[65]:
0
count 100.000000
mean 0.482314
std 0.180375
min 0.000000
25% 0.362498
50% 0.497458
75% 0.594301
max 1.000000
In [72]:
plt.hist(data_minmax);
plt.title('Min-Max Scaled Data');
plt.axvline(x=np.min(data_minmax), ls=':', c='C0', label='Min');
plt.axvline(x=np.max(data_minmax), ls=':', c='C1', label='Max');
plt.legend();

Standard Scaler

This scaling assumes that the data is sampled from Normal distribution. $$x_{standard\,normalized} = \frac{x - mean(x)}{std(x)}$$

In [67]:
ss = StandardScaler()
ss.fit(df)
data_standard_scaled = ss.transform(df)
In [68]:
pd.DataFrame(pd.Series(data_standard_scaled.ravel()).describe())
Out[68]:
0
count 1.000000e+02
mean 3.552714e-17
std 1.005038e+00
min -2.687426e+00
25% -6.676092e-01
50% 8.437905e-02
75% 6.239799e-01
max 2.884513e+00
In [88]:
plt.axvspan(xmin=np.mean(data_standard_scaled)-3*np.std(data_standard_scaled), xmax=np.mean(data_standard_scaled)+3*np.std(data_standard_scaled), color='red', alpha=0.05,label=r'$Mean \pm 3\sigma$');
plt.hist(data_standard_scaled);
plt.title('Standard Scaled Data');
plt.axvline(x=np.mean(data_standard_scaled), ls='-.', c='red', label='Mean');
plt.legend();

One-Hot Encode Nominal Categorical Features

Goal

This post aims to introduce how to create one-hot-encoded features for categorical variables. In this post, two ways of creating one hot encoded features: OneHotEncoder in scikit-learn and get_dummies in pandas.

Peronally, I like get_dummies in pandas since pandas takes care of columns names, type of data and therefore, it looks cleaner and simpler with less code.

image

Reference

Convert Strings To Dates

Goal

This post aims to introduce how to convert strings to dates using pandas

Libraries

In [1]:
import pandas as pd

Date in string

In [3]:
df_date = pd.DataFrame({'date':['20190101', '20190102', '20190105'], 
                       'temperature': [23.5, 32, 25]})
df_date
Out[3]:
date temperature
0 20190101 23.5
1 20190102 32.0
2 20190105 25.0

Convert strings to date format

In [4]:
pd.to_datetime(df_date['date'])
Out[4]:
0   2019-01-01
1   2019-01-02
2   2019-01-05
Name: date, dtype: datetime64[ns]

Parse HTML

Goal

This post aims to introduce how to parse the HTML data fetched by BeautifulSoup

Reference

Library

In [12]:
from bs4 import BeautifulSoup
import requests

Simple HTML from string

In [24]:
html_simple = '<h1>This is Title<h1>'
html_simple
Out[24]:
'<h1>This is Title<h1>'
In [25]:
soup = BeautifulSoup(html_simple)
In [26]:
soup.text
Out[26]:
'This is Title'

Dimensionality Reduction With PCA

Goal

This post aims to introduce how to conduct dimensionality reduction with Principal Component Analysis (PCA).

Dimensionality reduction with PCA can be used as a part of preprocessing to improve the accuracy of prediction when we have a lot of features that has correlation mutually.

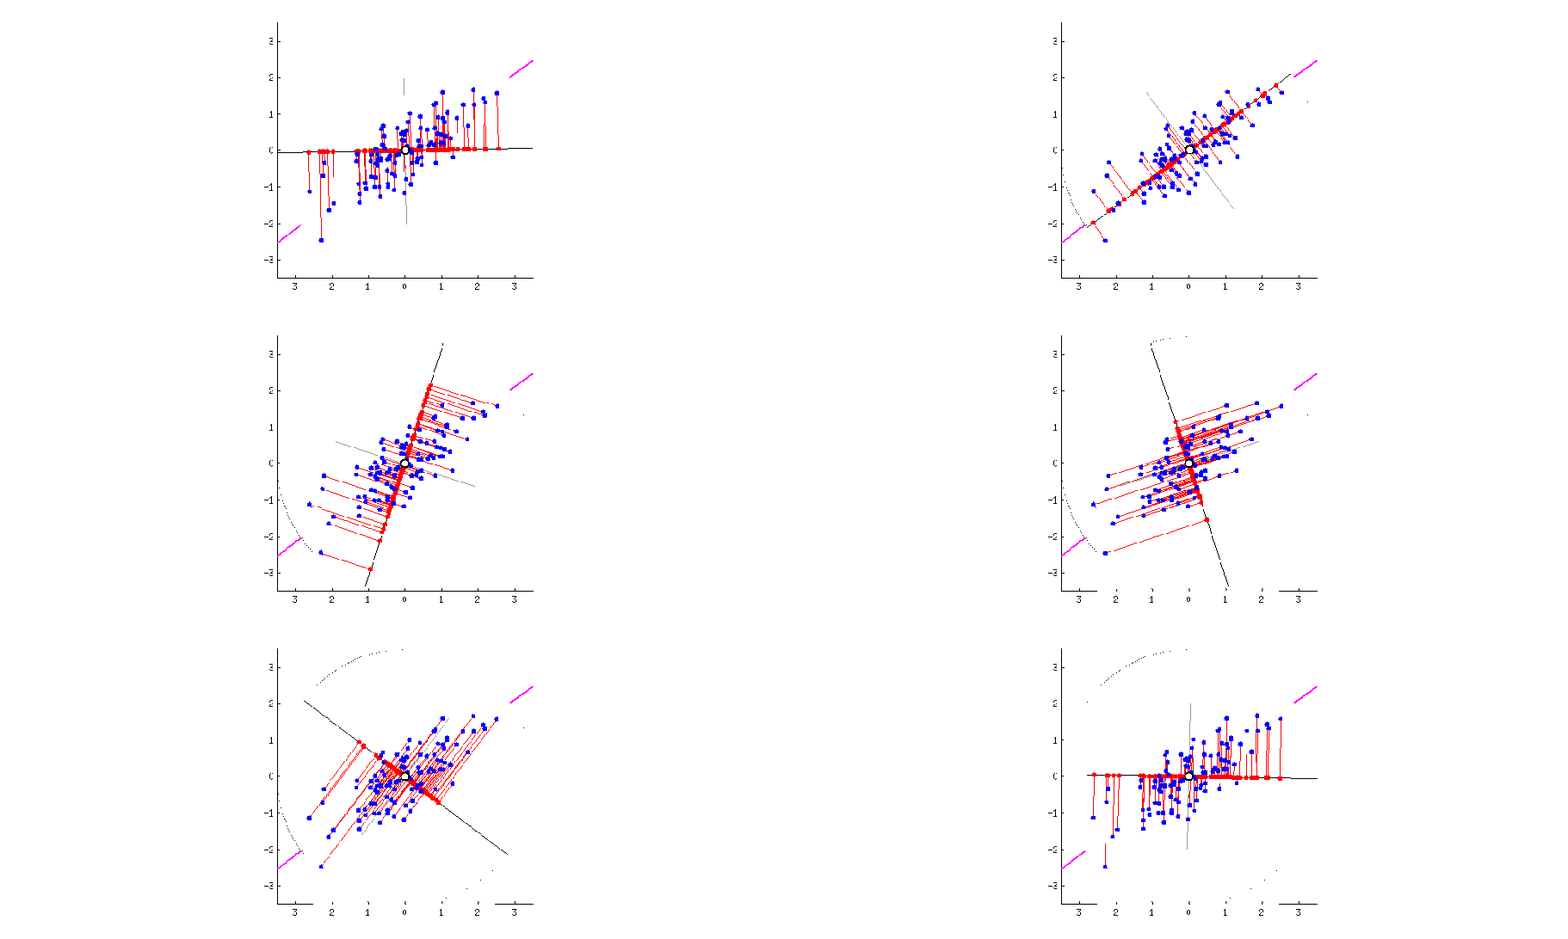
The figure below visually explains what PCA does. The blue dots are original data points in 2D. The red dots are projected data onto 1D rotating line. The red dotted line from blue points to red points are the trace of the projection. When the moving line overlaps with the pink line, the projected dot on the line is most widely distributed. If we apply PCA to this 2D data, 1D data can be obtained on this 1D line.

Visual Example of Dimensionality Reduction with PCA
Fig.1 PCA to project 2D data into 1D dimension from R-bloggers PCA in R

Reference