Logistic Regression
Libraries
In [1]:
import pandas as pd
import numpy as np
from sklearn.linear_model import LogisticRegression
from sklearn.model_selection import cross_val_score
import matplotlib.pyplot as plt
%matplotlib inline
Create dummy data
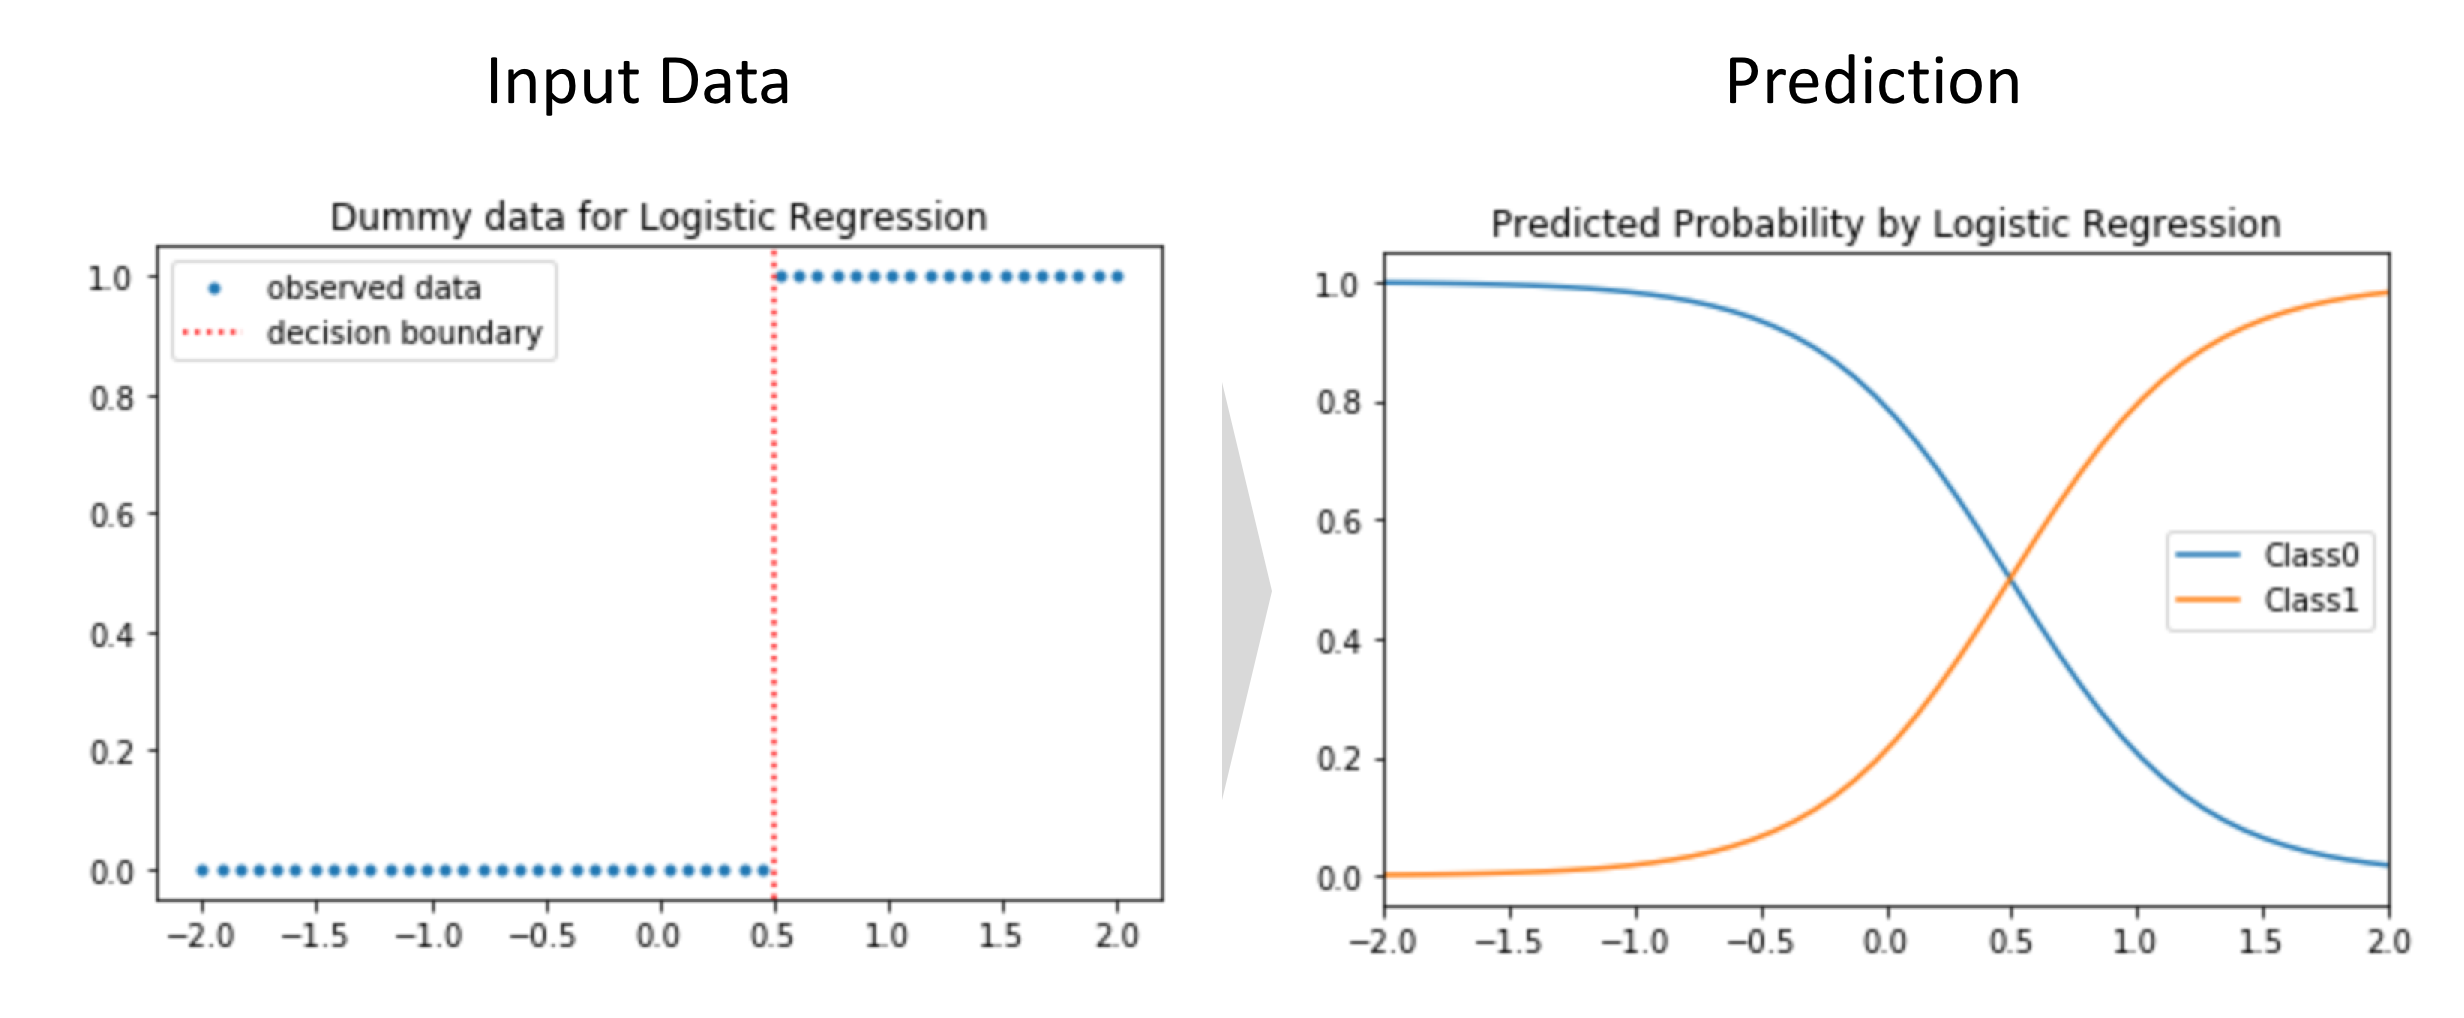
Let's create 1-dimensional $\mathbf{y}$ data which has binary output between 0 and 1. Simply, $\mathbf{y} = 1$ if $x > 0.5$ and $\mathbf{y} = 0$ if $x <= 0.5$ as below.
In [16]:
x = np.linspace(-2, 2, num=50)
threshold = 0.5
y = 1 * (x > 0.5)

# Visualization
plt.plot(x, y, '.', label='observed data');
plt.axvline(threshold, ls='dotted', c='r', label='decision boundary');
plt.legend();
plt.title('Dummy data for Logistic Regression');

Fitting
Now we can see how the coefficient A and the intercept b are close to the ones I used to create this dataset.
In [39]:
clf = LogisticRegression(solver='lbfgs')
clf.fit(x.reshape(-1, 1), y);
In [57]:
df_predicted_probability = pd.DataFrame(clf.predict_proba(x.reshape(-1, 1)),index=x,
                                        columns=["Class" + str(c) for c in clf.classes_])
In [59]:
df_predicted_probability.plot(title='Predicted Probability by Logistic Regression');

Comments
Comments powered by Disqus