Activation Functions in Neural Networks
Goal
This post aims to introduce activation functions used in neural networks using pytorch.
Reference
Libraries
In [47]:
import numpy as np
import matplotlib.pyplot as plt
%matplotlib inline

import torch.nn as nn
Activation Functions
In this post, the following activation functions are introduced.
- Sigmoid
- Tanh
- ReLU
- Leaky ReLU
Create a input data
In [48]:
x = np.linspace(-5, 5, 100)
t_x = torch.tensor(x)
d_activations = {}
Sigmoid
$$ Sigmoid (x) = \frac{1} {1 + exp (-x)} $$In [49]:
d_activations['Sigmoid'] = nn.Sigmoid()
y = d_activations['Sigmoid'](t_x)

plt.plot(t_x.numpy(), y.numpy(), '.');
plt.title('Sigmoid activation function');
plt.xlabel('Input x'); plt.ylabel('Output y')
plt.ylim([-1.5, 1.5]);

Tanh
$$Tanh(x) = \frac{e^x - e^{-x}}{e^x + e^{-x}}$$In [50]:
d_activations['Tanh'] = nn.Tanh()
y = d_activations['Tanh'](t_x)

plt.plot(t_x.numpy(), y.numpy(), '.');
plt.title('Tanh activation function');
plt.xlabel('Input x'); plt.ylabel('Output y')
plt.ylim([-1.5, 1.5]);

ReLU
Relu stands for Rectified linear unit $$Relu(x) = max(0, x) $$
In [51]:
act_function = 'ReLU'
d_activations[act_function] = nn.ReLU()
y = d_activations[act_function](t_x)

plt.plot(t_x.numpy(), y.numpy(), '.');
plt.title(f'{act_function} activation function');
plt.xlabel('Input x'); plt.ylabel('Output y')
plt.ylim([-1.5, 1.5]);

Leaky ReLU
$$ LeakyReLU() = max(0, x) + negative\_slope * min(0, x) $$negative_slope is a small value added to the output output when $x < 0$
In [52]:
act_function = 'Leeky ReLU'
d_activations[act_function] = nn.LeakyReLU()
y = d_activations[act_function](t_x)

plt.plot(t_x.numpy(), y.numpy(), '.');
plt.title(f'{act_function} activation function');
plt.xlabel('Input x'); plt.ylabel('Output y')
plt.ylim([-1.5, 1.5]);

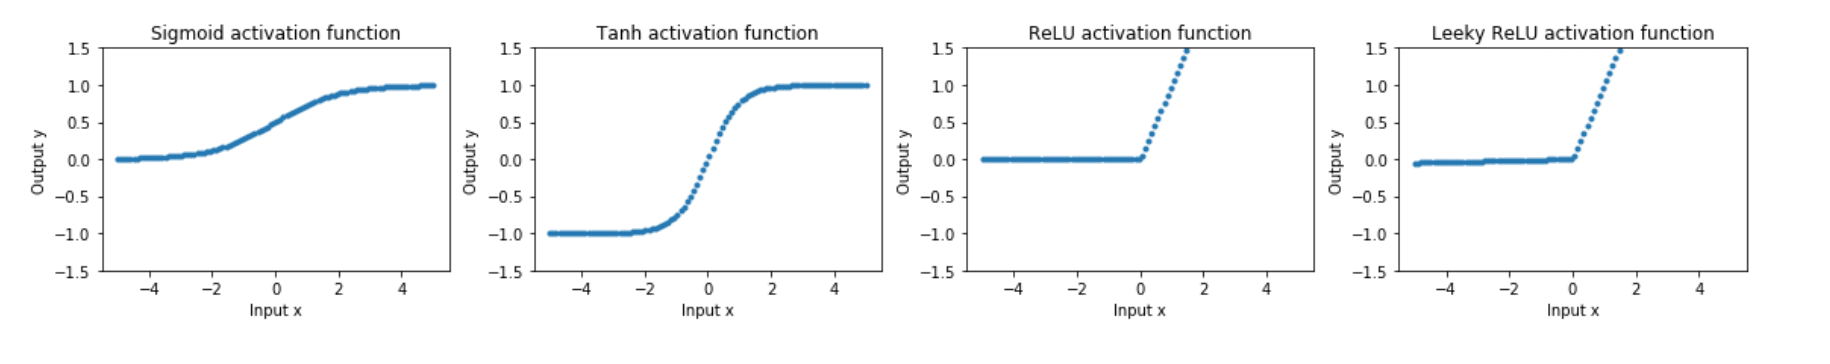
Summary
In [63]:
fig, axes = plt.subplots(1, len(d_activations), figsize=(16, 3))

for i, f in enumerate(d_activations.keys()):

    axes[i].plot(t_x.numpy(), d_activations[f](t_x).numpy(), '.');
    axes[i].set_title(f'{f} activation function');
    axes[i].set_xlabel('Input x'); axes[i].set_ylabel('Output y')
    axes[i].set_ylim([-1.5, 1.5]);
plt.tight_layout()

Comments
Comments powered by Disqus