Time Series Forecasting for Daily Births Dataset by Prophet
Goal
This post aims to introduce how to forecast the time series data for daily births dataset using Prophet.
Prohpeht Forecasting Model
$$ y (y) = g(t) + s(t) + h(t) + \epsilon_t $$- $g(t)$: a growth term, which is a trend curve
- $s(t)$: a seasonality term, which periodically changes
- $h(t)$: a holiday term, which indicates irregular events (given by users)
- $\epsilon_t$: an error term
Reference
Libraries
In [55]:
import pandas as pd
import numpy as np
import fbprophet
from fbprophet.plot import add_changepoints_to_plot
import warnings
import matplotlib.pyplot as plt
%matplotlib inline
Load a female daily births dataset
In [30]:
url = "https://raw.githubusercontent.com/jbrownlee/Datasets/master/daily-total-female-births.csv"
df = pd.read_csv(url, parse_dates=['Date'], date_parser=pd.to_datetime)
df.columns = ['ds', 'y']
df.head()
Out[30]:
Visualize the raw data
In [40]:
plt.plot(df['ds'], df['y']);
plt.title('Daily Female Births in 1959');

Create a Prophet instance
In [76]:
with warnings.catch_warnings():
    warnings.simplefilter("ignore")
    m = fbprophet.Prophet(yearly_seasonality=True, daily_seasonality=False,
                          changepoint_range=0.9,
                          changepoint_prior_scale=0.5,
                          seasonality_mode='multiplicative')
    m.fit(df);
In [77]:
future = m.make_future_dataframe(periods=50, freq='d')
forecast = m.predict(future)
Visualize
By Component
In [78]:
m.plot_components(forecast);

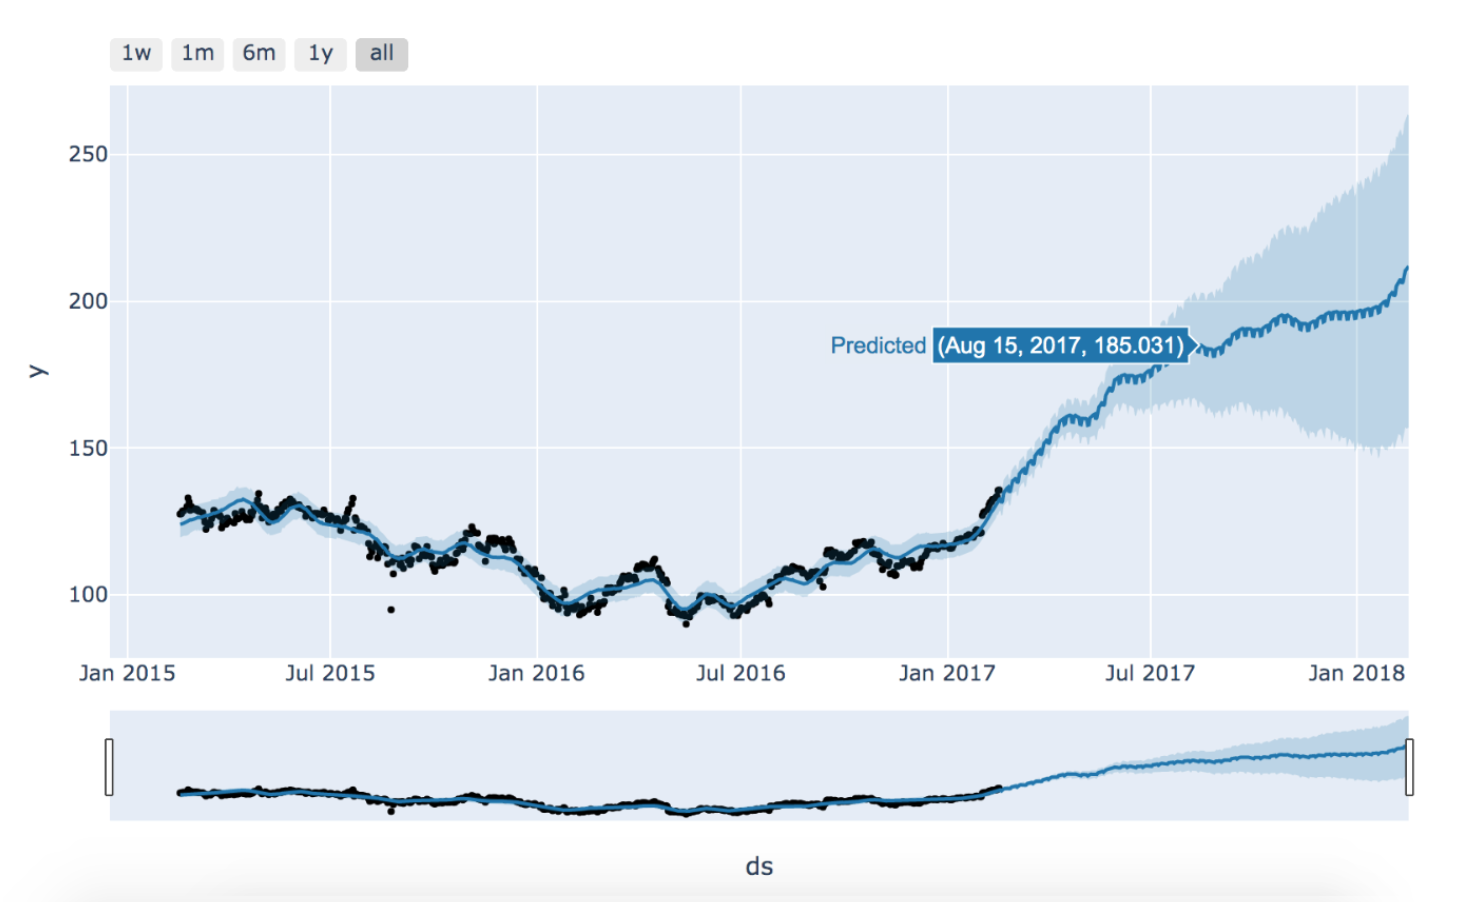
Plot raw data with forecast
In [79]:
m.plot(forecast);

Change point detection
No change is detected.
In [80]:
fig = m.plot(forecast)
a = add_changepoints_to_plot(fig.gca(), m, forecast);