Prophet 101: a time-series forecasting module
Goal
This post aims to introduce the basics of Prophet, which is a time-series forecasting module implemented by Facebook.
Reference
Libraries
In [1]:
import pandas as pd
from fbprophet import Prophet
from fbprophet.plot import plot_plotly
import plotly.offline as py
py.init_notebook_mode()
Load a time series data
In [11]:
df = pd.read_csv("https://raw.githubusercontent.com/plotly/datasets/master/finance-charts-apple.csv").iloc[:, :2]
df.head()
Out[11]:
modify the data for Prophet
In [12]:
df.rename(columns={'Date': 'ds', 'AAPL.Open': 'y'}, inplace=True)
df.head()
Out[12]:
In [15]:
df.tail()
Out[15]:
Create a Prophet instance
In [13]:
m = Prophet()
m.fit(df)
Out[13]:
Make a prediction
Create a future date range
In [17]:
date_future = m.make_future_dataframe(periods=365)
date_future.head()
Out[17]:
In [18]:
date_future.tail()
Out[18]:
Make a prediction
In [19]:
df_forecast = m.predict(date_future)
df_forecast[['ds', 'yhat', 'yhat_lower', 'yhat_upper']].tail()
Out[19]:
Visualization
Visualize the values with confidence
In [20]:
fig1 = m.plot(df_forecast)

Visualize by components
In [22]:
fig2 = m.plot_components(df_forecast)

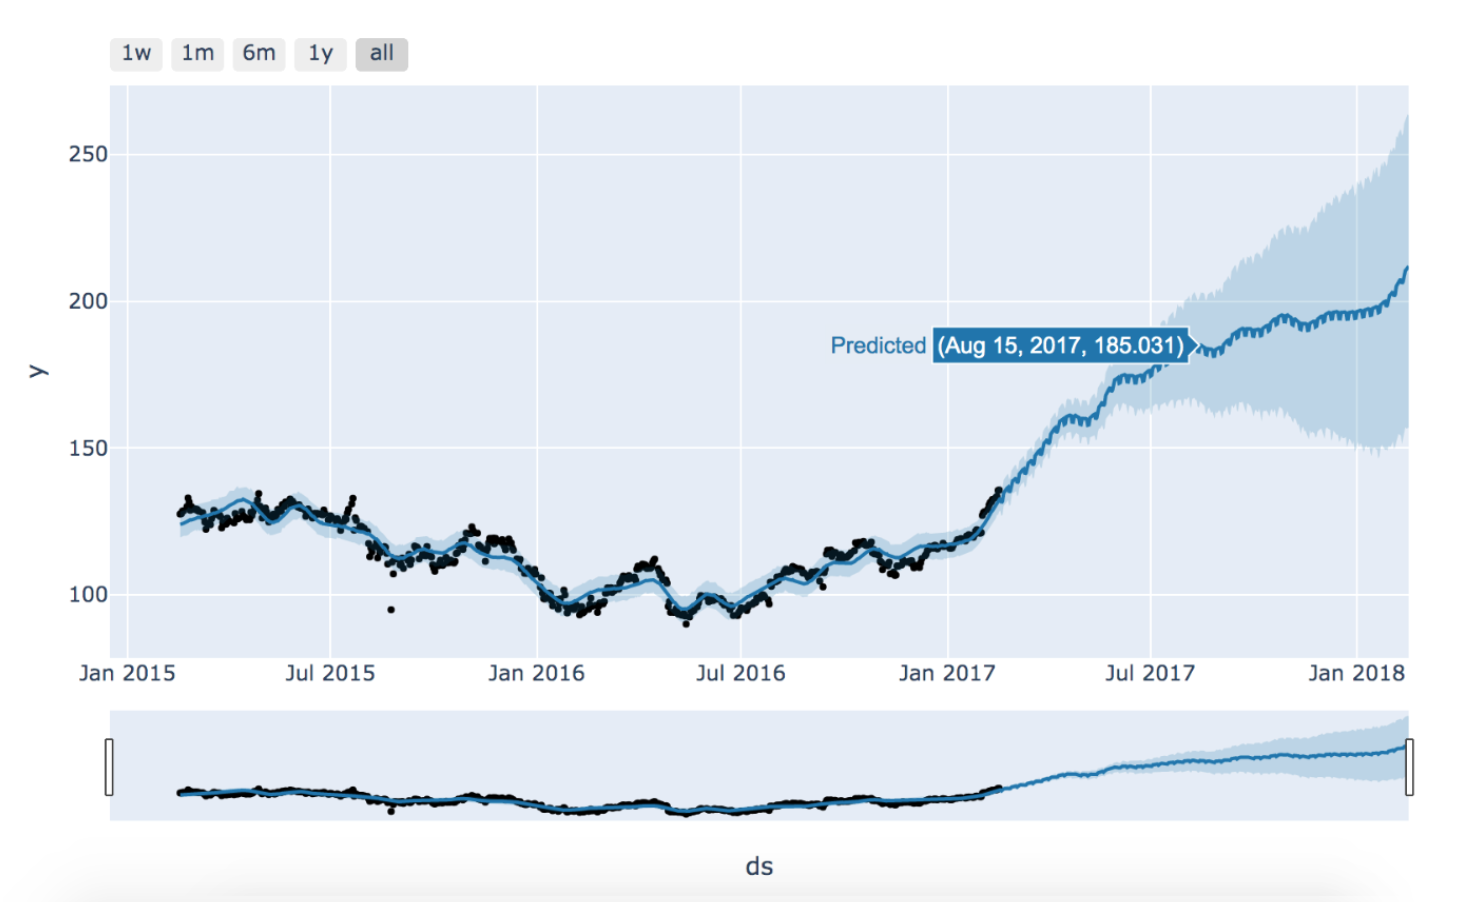
Visualize interactive plots
In [ ]:
fig = plot_plotly(m, df_forecast)
py.iplot(fig)
Comments
Comments powered by Disqus