Getting real-time stock market data and visualization
Goal
This post aims to introduce how to get real time stock market data using Yahoo finance API yahoo_fin and visualize it as candle chart using cufflinks.
Reference
Libraries
In [70]:
import pandas as pd
from yahoo_fin import stock_info
from plotly.offline import plot, init_notebook_mode
init_notebook_mode()
import cufflinks as cf
%matplotlib inline
cf.set_config_file(offline=True)
Get real time stock price data
In [76]:
stock_info.get_live_price('msft')
Out[76]:
Get stock tables as pandas table
In [61]:
d_df = {}
d_df['msft'] = stock_info.get_data('msft', start_date='01/01/2019', end_date='06/01/2019')
d_df['msft'].head()
Out[61]:
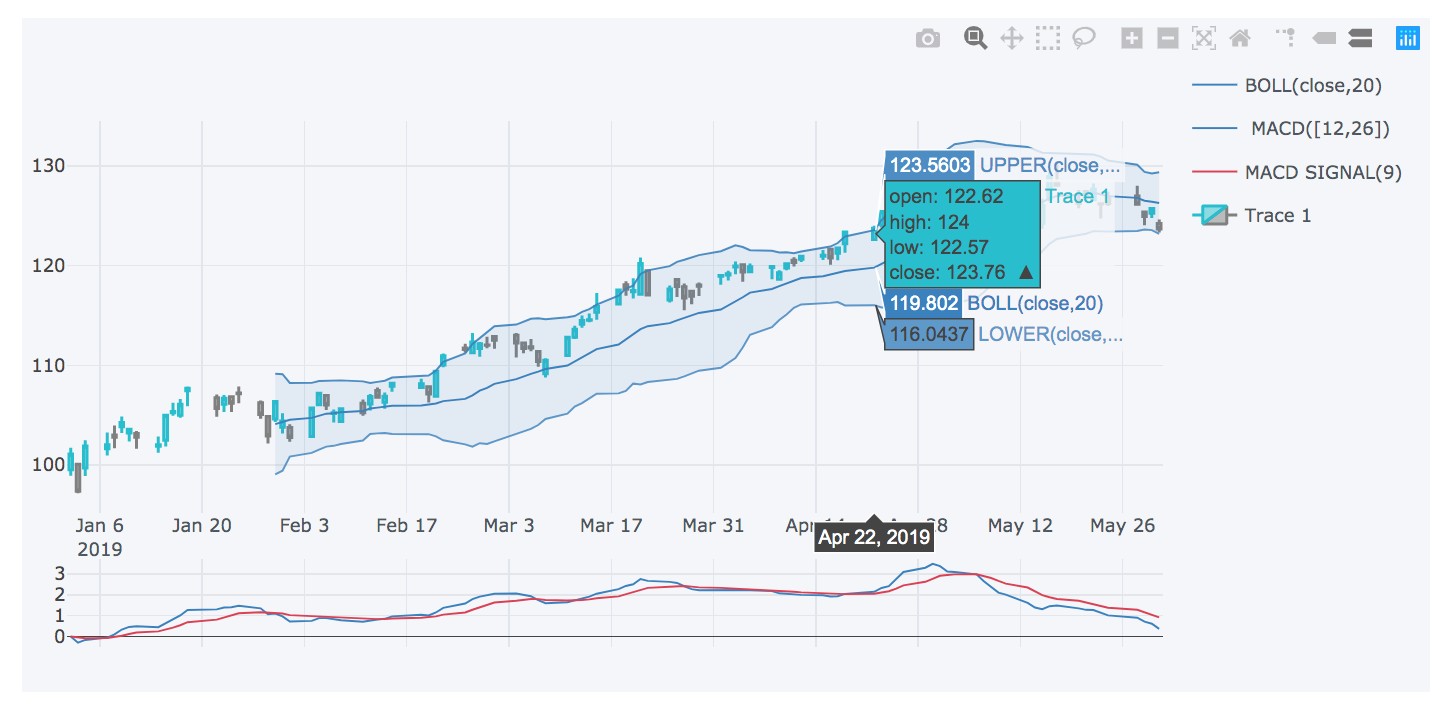
Visualize the obtained stock data
In [75]:
# visualiz stock data
qf = cf.QuantFig(d_df['msft'])
qf.add_bollinger_bands()
qf.add_macd()
qf.iplot()
Comments
Comments powered by Disqus