Make Simulated Data For Anomaly Detection
Goal
This post aims to introduce how to make simulated data for anomaly detection using PyOD, which is outlier detection package.
Reference
Libraries
In [58]:
import pandas as pd
import numpy as np
import matplotlib.pyplot as plt
%matplotlib inline

# PyOD
from pyod.utils.data import generate_data, get_outliers_inliers
Create an anomaly dataset
Create random data with 5 features
In [21]:
X_train, X_test, y_train, y_test = generate_data(behaviour='new', n_features=5)
df_tr = pd.DataFrame(X_train)
df_tr['y'] = y_train
df_te = pd.DataFrame(X_test)
df_te['y'] = y_test
In [22]:
df_tr.head()
Out[22]:
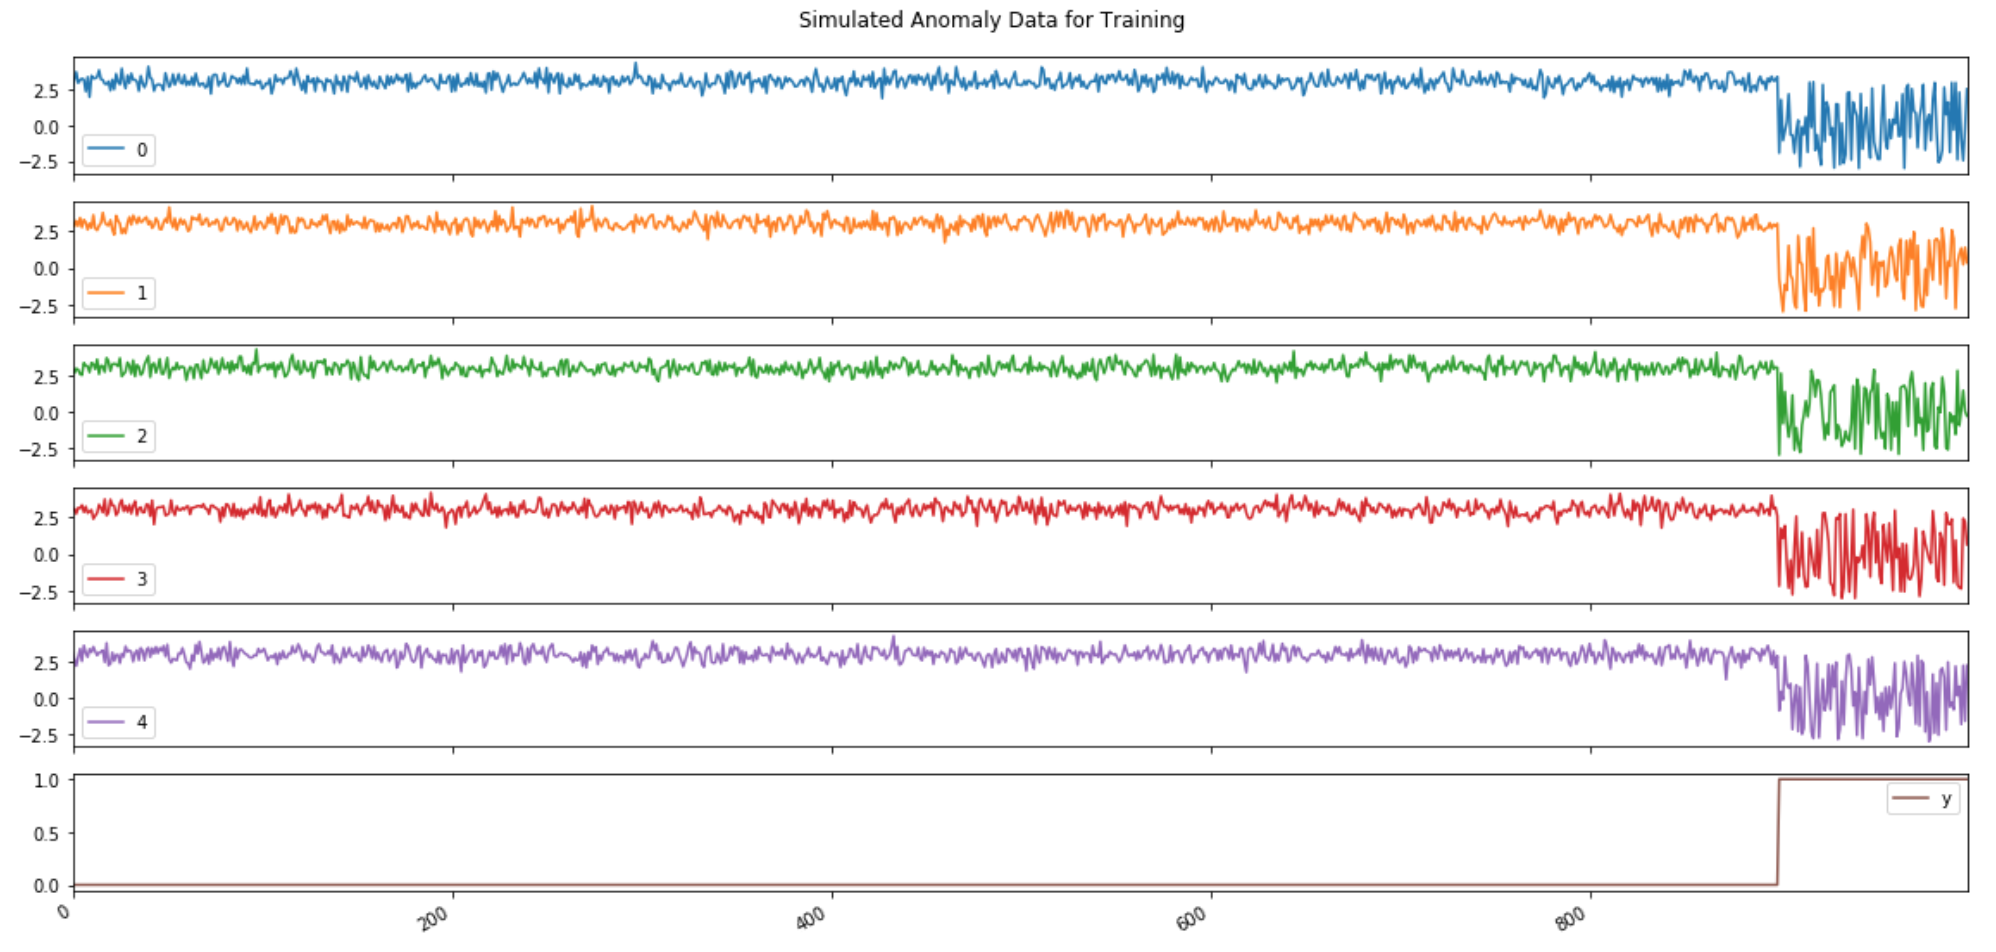
Visualize created anomaly data
In [57]:
axes = df_tr.plot(subplots=True, figsize=(16, 8), title='Simulated Anomaly Data for Training');
plt.tight_layout(rect=[0, 0.03, 1, 0.95])

In [56]:
axes = df_te.plot(subplots=True, figsize=(16, 8), title='Simulated Anomaly Data for Test');
plt.tight_layout(rect=[0, 0.03, 1, 0.95])

Comments
Comments powered by Disqus