Sentiment Analysis by SHAP with Logistic Regression

Goal

This post aims to introduce how to do sentiment analysis using SHAP with logistic regression.

Reference

Libraries

In [4]:
import sklearn
from sklearn.feature_extraction.text import TfidfVectorizer
from sklearn.model_selection import train_test_split
import numpy as np
import pandas as pd
import matplotlib.pyplot as plt
import shap
%matplotlib inline

shap.initjs()

Load the IMDB dataset

In [5]:
corpus, y = shap.datasets.imdb()
corpus_train, corpus_test, y_train, y_test = train_test_split(corpus,
                                                              y,
                                                              test_size=0.2,
                                                              random_state=7)

"Review" example in the corpus

In [18]:
# Example of one review 
corpus_train[0][:200]
Out[18]:
"I was excited when I heard they were finally making this horrific event into a movie. The whole era (1980's Southern California) and subject matter (drug and porn industry) is intriguing to me. I thou"
In [10]:
# Target value
y[0]
Out[10]:
False

Length of each review

In [102]:
df_len = pd.DataFrame({'length of each review':[len(c) for c in corpus]})
In [103]:
df_len.hist(bins=100);
In [59]:
pd.Series(y).value_counts().plot(kind='bar', title='Y Label for Corpus');

Preprocessing

We obtain the apply TFID vectorization to convert a collection of words to a matrix of TF-IDF features.

In [68]:
# Instanciate vectorizer
vectorizer = TfidfVectorizer(min_df=10)
In [69]:
# Train vectorizer
X_train = vectorizer.fit_transform(corpus_train)
# Apply vectorizer to test data
X_test = vectorizer.transform(corpus_test)

Preprocessed data

After applying TFID vecterization, we will obtain the score in a large dimension. In this case, the dimension size is 16416.

In [70]:
X_test[0].shape
Out[70]:
(1, 16416)
In [71]:
X_test[:5].data[:5]
Out[71]:
array([0.04277508, 0.14533082, 0.02100824, 0.01887938, 0.01996805])

Train the logistic regression

In [72]:
reg = sklearn.linear_model.LogisticRegression(penalty="l2",
                                              C=0.1,
                                              solver='lbfgs')
reg.fit(X_train, y_train)
Out[72]:
LogisticRegression(C=0.1, class_weight=None, dual=False, fit_intercept=True,
          intercept_scaling=1, max_iter=100, multi_class='warn',
          n_jobs=None, penalty='l2', random_state=None, solver='lbfgs',
          tol=0.0001, verbose=0, warm_start=False)

Sensitivity Analysis

To compute SHAP value for the regression, we use LinearExplainer.

Build an explainer

In [73]:
explainer = shap.LinearExplainer(reg,
                                 X_train,
                                 feature_dependence="independent")

Compute SHAP values for test data

In [74]:
shap_values = explainer.shap_values(X_test)
shap_values[0]
Out[74]:
array([[ 6.07763522e-06,  8.53307578e-05, -2.06447665e-06, ...,
        -2.60165231e-05, -1.75486507e-05, -2.56592766e-06],
       [ 6.07763522e-06,  8.53307578e-05, -2.06447665e-06, ...,
        -2.60165231e-05, -1.75486507e-05, -2.56592766e-06],
       [ 6.07763522e-06,  8.53307578e-05, -2.06447665e-06, ...,
        -2.60165231e-05, -1.75486507e-05, -2.56592766e-06],
       ...,
       [ 6.07763522e-06,  8.53307578e-05, -2.06447665e-06, ...,
        -2.60165231e-05, -1.75486507e-05, -2.56592766e-06],
       [ 6.07763522e-06,  8.53307578e-05, -2.06447665e-06, ...,
        -2.60165231e-05, -1.75486507e-05, -2.56592766e-06],
       [ 6.07763522e-06,  8.53307578e-05, -2.06447665e-06, ...,
        -2.60165231e-05, -1.75486507e-05, -2.56592766e-06]])

Plot the features importance

In [75]:
X_test_array = X_test.toarray()
shap.summary_plot(shap_values,
                  X_test_array,
                  feature_names=vectorizer.get_feature_names())

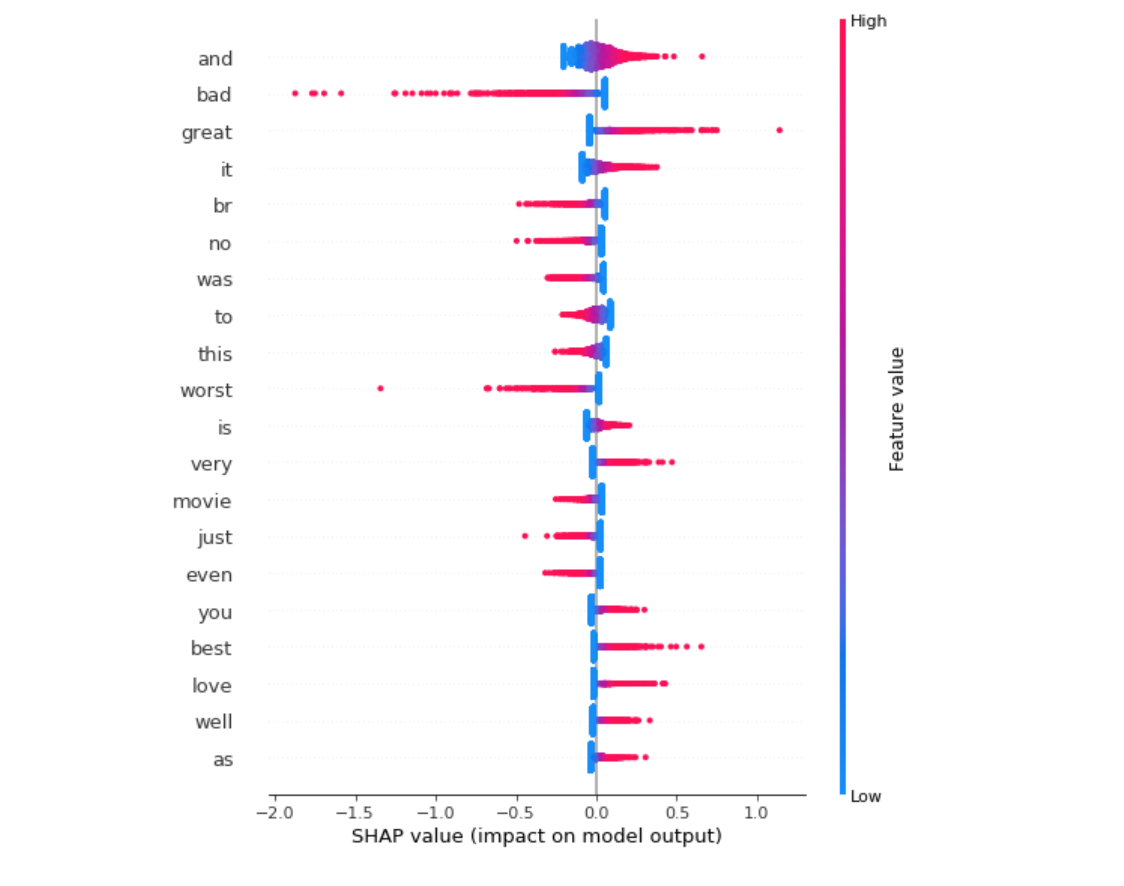
Plot the SHAP values for top features

In [101]:
# shap_values does not work since it is recognized as `list` and default to `bar` chart only. 
# so it changed to shap_values[0]
shap.summary_plot(shap_values[0],
                  X_test_array,
                  feature_names=vectorizer.get_feature_names(),
                  plot_type='dot')

Explain the sentiment for one review

I tried to follow the example notebook Github - SHAP: Sentiment Analysis with Logistic Regression but it seems it does not work as it is due to json seriarization.

In [84]:
X_test_array[i, :]
Out[84]:
array([0., 0., 0., ..., 0., 0., 0.])
In [100]:
ind = 0
shap.force_plot(
    explainer.expected_value, shap_values[0][ind,:], X_test_array[ind,:],
    feature_names=vectorizer.get_feature_names()
)
---------------------------------------------------------------------------
TypeError                                 Traceback (most recent call last)
<ipython-input-100-0ae897f509cf> in <module>
      2 shap.force_plot(
      3     explainer.expected_value, shap_values[0][ind,:], X_test_array[ind,:],
----> 4     feature_names=vectorizer.get_feature_names()
      5 )

~/anaconda3/envs/py367/lib/python3.6/site-packages/shap/plots/force.py in force_plot(base_value, shap_values, features, feature_names, out_names, link, plot_cmap, matplotlib, show, figsize, ordering_keys, ordering_keys_time_format, text_rotation)
    132         )
    133 
--> 134         return visualize(e, plot_cmap, matplotlib, figsize=figsize, show=show, text_rotation=text_rotation)
    135 
    136     else:

~/anaconda3/envs/py367/lib/python3.6/site-packages/shap/plots/force.py in visualize(e, plot_cmap, matplotlib, figsize, show, ordering_keys, ordering_keys_time_format, text_rotation)
    271             return AdditiveForceVisualizer(e, plot_cmap=plot_cmap).matplotlib(figsize=figsize, show=show, text_rotation=text_rotation)
    272         else:
--> 273             return AdditiveForceVisualizer(e, plot_cmap=plot_cmap).html()
    274     elif isinstance(e, Explanation):
    275         if matplotlib:

~/anaconda3/envs/py367/lib/python3.6/site-packages/shap/plots/force.py in html(self, label_margin)
    362     document.getElementById('{id}')
    363   );
--> 364 </script>""".format(err_msg=err_msg, data=json.dumps(self.data), id=id_generator()))
    365 
    366     def matplotlib(self, figsize, show, text_rotation):

~/anaconda3/envs/py367/lib/python3.6/json/__init__.py in dumps(obj, skipkeys, ensure_ascii, check_circular, allow_nan, cls, indent, separators, default, sort_keys, **kw)
    229         cls is None and indent is None and separators is None and
    230         default is None and not sort_keys and not kw):
--> 231         return _default_encoder.encode(obj)
    232     if cls is None:
    233         cls = JSONEncoder

~/anaconda3/envs/py367/lib/python3.6/json/encoder.py in encode(self, o)
    197         # exceptions aren't as detailed.  The list call should be roughly
    198         # equivalent to the PySequence_Fast that ''.join() would do.
--> 199         chunks = self.iterencode(o, _one_shot=True)
    200         if not isinstance(chunks, (list, tuple)):
    201             chunks = list(chunks)

~/anaconda3/envs/py367/lib/python3.6/json/encoder.py in iterencode(self, o, _one_shot)
    255                 self.key_separator, self.item_separator, self.sort_keys,
    256                 self.skipkeys, _one_shot)
--> 257         return _iterencode(o, 0)
    258 
    259 def _make_iterencode(markers, _default, _encoder, _indent, _floatstr,

~/anaconda3/envs/py367/lib/python3.6/json/encoder.py in default(self, o)
    178         """
    179         raise TypeError("Object of type '%s' is not JSON serializable" %
--> 180                         o.__class__.__name__)
    181 
    182     def encode(self, o):

TypeError: Object of type 'matrix' is not JSON serializable

Comments

Comments powered by Disqus