Explain the prediction for ImageNet using SHAP
Libraries
In [82]:
import keras
from keras.applications.vgg16 import VGG16, preprocess_input, decode_predictions
from keras.preprocessing import image
import requests
from skimage.segmentation import slic
import pandas as pd
import numpy as np
import matplotlib.pyplot as plt
import shap
import warnings

%matplotlib inline
Configuration
In [77]:
# make a color map
from matplotlib.colors import LinearSegmentedColormap
colors = []
for l in np.linspace(1, 0, 100):
    colors.append((245 / 255, 39 / 255, 87 / 255, l))
for l in np.linspace(0, 1, 100):
    colors.append((24 / 255, 196 / 255, 93 / 255, l))
cm = LinearSegmentedColormap.from_list("shap", colors)
Load pre-trained VGG16 model
In [2]:
# load model data
r = requests.get('https://s3.amazonaws.com/deep-learning-models/image-models/imagenet_class_index.json')
feature_names = r.json()
model = VGG16()
Load an image data
In [16]:
# load an image
file = "../images/apple-banana.jpg"
img = image.load_img(file, target_size=(224, 224))
img_orig = image.img_to_array(img)
plt.imshow(img);
plt.axis('off');

Segmentation
In [18]:
# Create segmentation to explain by segment, not every pixel
segments_slic = slic(img, n_segments=30, compactness=30, sigma=3)

plt.imshow(segments_slic);
plt.axis('off');

In [37]:
segments_slic
Out[37]:
Utility Functions for masking and preprocessing
In [19]:
# define a function that depends on a binary mask representing if an image region is hidden
def mask_image(zs, segmentation, image, background=None):

    if background is None:
        background = image.mean((0, 1))

    # Create an empty 4D array
    out = np.zeros((zs.shape[0],
                    image.shape[0],
                    image.shape[1],
                    image.shape[2]))

    for i in range(zs.shape[0]):
        out[i, :, :, :] = image
        for j in range(zs.shape[1]):
            if zs[i, j] == 0:
                out[i][segmentation == j, :] = background
    return out


def f(z):
    return model.predict(
        preprocess_input(mask_image(z, segments_slic, img_orig, 255)))

def fill_segmentation(values, segmentation):
    out = np.zeros(segmentation.shape)
    for i in range(len(values)):
        out[segmentation == i] = values[i]
    return out
In [39]:
masked_images = mask_image(np.zeros((1,50)), segments_slic, img_orig, 255)

plt.imshow(masked_images[0][:,:, 0]);
plt.axis('off');

Create an explainer and shap values
In [83]:
# use Kernel SHAP to explain the network's predictions
explainer = shap.KernelExplainer(f, np.zeros((1,50)))

with warnings.catch_warnings():
    warnings.simplefilter("ignore")
    shap_values = explainer.shap_values(np.ones((1,50)), nsamples=100) # runs VGG16 1000 times
Obtain the prediction with the highest probability
In [85]:
predictions = model.predict(preprocess_input(np.expand_dims(img_orig.copy(), axis=0)))
top_preds = np.argsort(-predictions)
In [86]:
pd.Series(data={feature_names[str(inds[i])][1]:predictions[0, inds[i]] for i in range(10)}).plot(kind='bar', title='Top 10 Predictions');

Explain the prediction by visualization
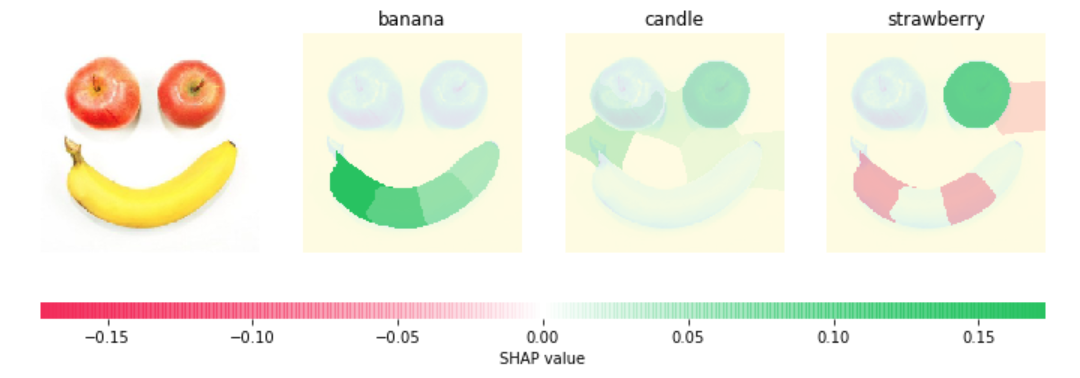
The following image is explained well for banana.
In [87]:
# Visualize the explanations
fig, axes = plt.subplots(nrows=1, ncols=4, figsize=(12,4))
inds = top_preds[0]
axes[0].imshow(img)
axes[0].axis('off')

max_val = np.max([np.max(np.abs(shap_values[i][:,:-1])) for i in range(len(shap_values))])
for i in range(3):
    m = fill_segmentation(shap_values[inds[i]][0], segments_slic)
    axes[i+1].set_title(feature_names[str(inds[i])][1])
    axes[i+1].imshow(np.array(img.convert('LA'))[:, :, 0], alpha=0.15)
    im = axes[i+1].imshow(m, cmap=cm, vmin=-max_val, vmax=max_val)
    axes[i+1].axis('off')
cb = fig.colorbar(im, ax=axes.ravel().tolist(), label="SHAP value", orientation="horizontal", aspect=60)
cb.outline.set_visible(False)
plt.show()

Comments
Comments powered by Disqus